The raw data and configuration for gnuplot is here.
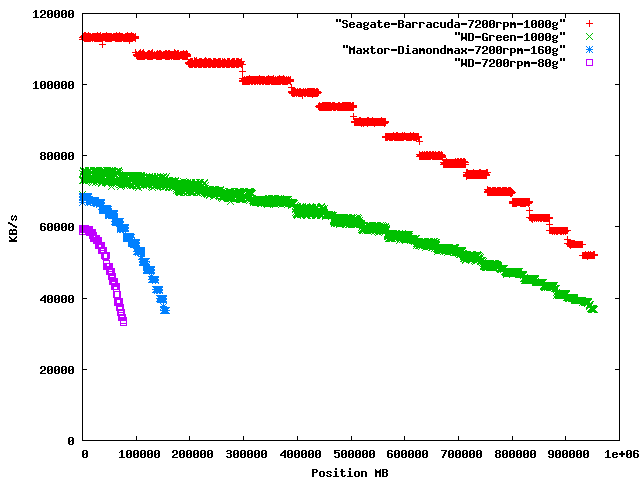
One thing to note is that the 1TB disks (from Seagate and WD) are the same size and have just over 10^12 bytes, which is significantly less than 2^40 which is the number that most people think about when the term "tera" is used in the context of computers.
The raw data and configuration for GNUplot is here.
The number of zones on the disk surprised me. I was only expecting 3 or at most 4.
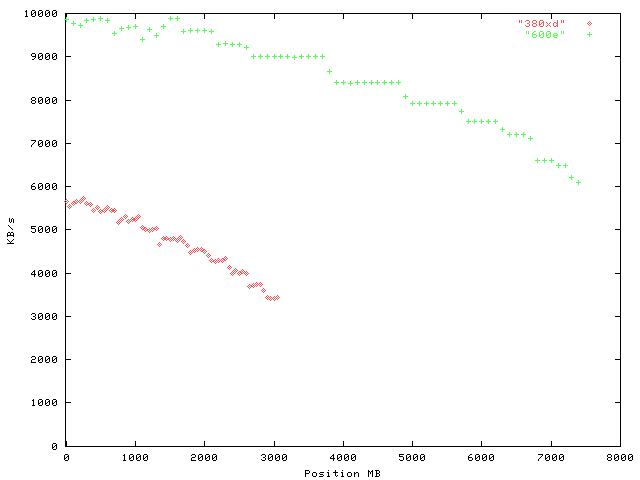
One thing to note is that the 380xd has a much slower hard drive, but the fastest part of it's drive is almost as fast as the slowest part of the 600e's drive. It is quite easy to imagine scenarios where you can store some data on the past part of a slow hard drive for better performance than the slow part of a fast hard drive!
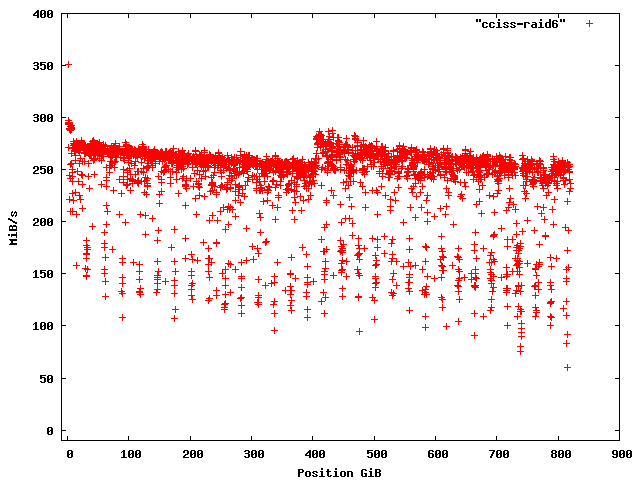
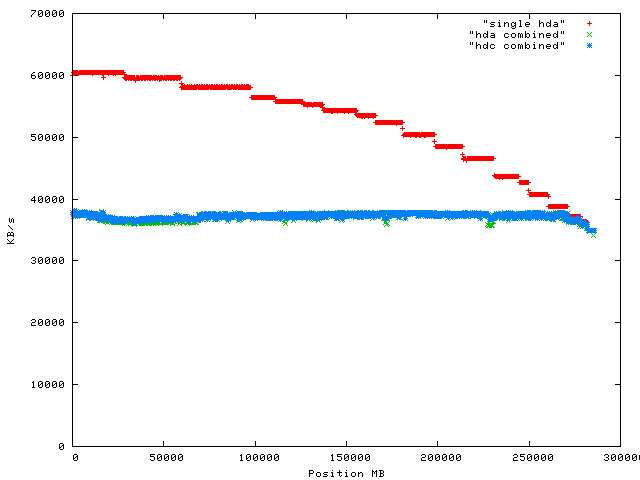
The drives can sustain up to 60M/s when running on their own, the red dots on
the graph show clear plateaus. The blue and green graphs indicate that there
is a system limit on the IO performance of an aggregate of less than 80M/s.
The raw data and configuration for gnuplot is here.
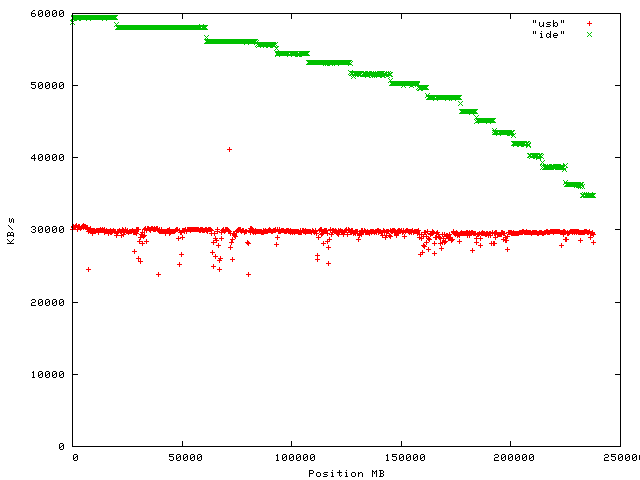
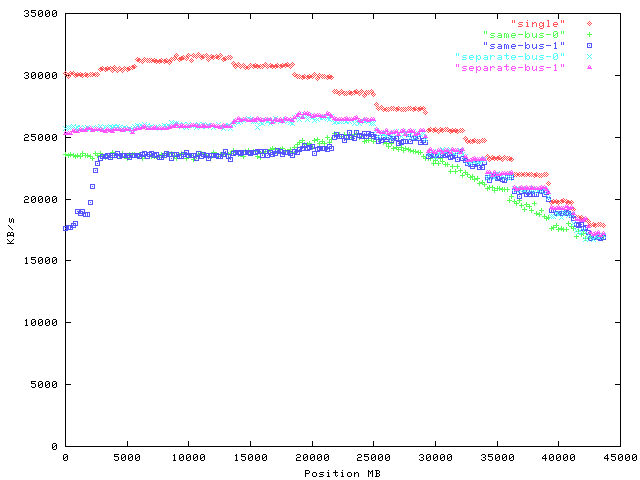
Below are the results from running ZCAV on a pair of 46G IBM drives on an
Athlon 800MHz machine with ATA66 running Linux 2.4.x. The red dots indicate the
performance of a single disk. The light-blue and pink dots indicate the
performance of two disks running at the same time on separate buses (/dev/hda
and /dev/hdc). The blue and green dots indicate the performance of two disks
running on the same bus (/dev/hda and /dev/hdb). Note that the maximum
performance of two drives running on separate buses is about 26MB/s while the
maximum performance of two drives on the same bus is about 24MB/s. This
indicates to me that there is not much of a bottleneck associated with two
disks on the same bus and that the real bottleneck is two disks on the same
machine. I'm not sure if this is an issue of OS, motherboard, or just the
IDE controller (built in to the motherboard).
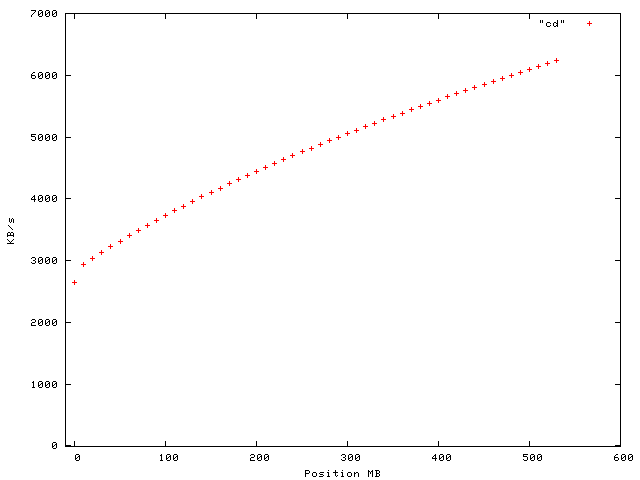
For CDs 1* speed means 150K/s over the ENTIRE CD, so 40* would
mean 6000K/s over the entire cd! From the following graph you can see that it
gets more than 40* speed at the end of the disk, but less than half that
at the start. I believe that this is because the drive can't vary the
rotational speed much (if at all) unlike the original data CD readers (and
probably all audio CD players), this means
that the data transfer speed varies across the media. The average speed is
about 30* (the next version of zcav will have to calculate this).
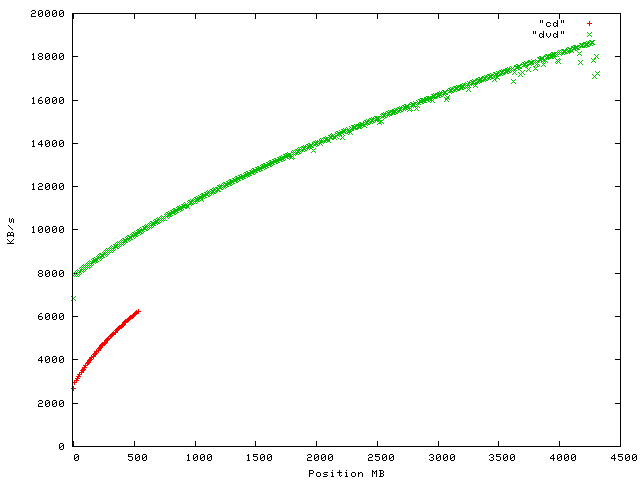
Here is a graph of the performance of CD and DVD reading together (I include
the CD data for interest because it doesn't obscure the DVD data). You can see
that the DVD speed ranges from 8000K/s to 18000K/s. This means that a
hypothetical 1* speed DVD would be somewhere between 500K/s and 1125K/s.
HP
states that 1* speed DVD is 1353K/s (normally I don't trust information
on such spec sheets, but I couldn't find anything better, if someone can inform
me of a more authoritative source of such information I would appreciate it).
If the HP data sheet is correct then Pioneer's claims of their
drive being 16* are slightly exaggerated as the fastest part of the
disc is not read at 16* speed!
Note that the slowest part of a DVD is faster than the fastest part of a CD.
If you wanted to install a 600M image file onto number of computers then you
would be better off using a DVD than a CD for performance reasons.
The raw data and configuration for gnuplot is here.